
How old are homes in Nashville, and what does that mean for a deck?
26% of homes in Nashville's covered ZIP codes were built in 2000 or later and 25% before 1960; the largest group dates to the 1980s.
Homes in Nashville have a median construction year of 1980, so a deck original to a typical house would now be about 46 years old — beyond the point where wood framing, fasteners and flashing can be assumed sound.
Many decks from the 1970s and 1980s were built before today's detailed deck provisions appeared in model codes. Common issues on decks of this age include corroded hangers, posts set directly in soil and ledger boards fastened with nails. Replacement is often the better value than repeated repairs.
That makes Nashville's housing 6 years older than Davidson County as a whole, where the median home was built in 1986. Statewide, the median Tennessee home was built in 1987. Among the 20 covered Tennessee communities with Census data, Nashville ranks #2 for oldest housing. In these ZIP codes, 25% of homes were built before 1960, 26% between 1960 and 1979, 23% between 1980 and 1999, and 26% since 2000 — the single largest group dates to the 1980s.
| Decade built | Homes | Share |
|---|---|---|
| 2020 or later | 7,424 | 4% |
| 2010s | 22,169 | 12% |
| 2000s | 18,832 | 10% |
| 1990s | 17,606 | 10% |
| 1980s | 25,108 | 14% |
| 1970s | 24,208 | 13% |
| 1960s | 22,624 | 12% |
| 1950s | 23,022 | 13% |
| 1940s | 8,376 | 5% |
| before 1940 | 14,080 | 8% |
What does Nashville's climate mean for deck construction?
Nashville averages about 76 days a year at or below freezing, 4.7 inches of snow and 50.5 inches of precipitation, based on NOAA 1991–2020 normals.
The nearest NOAA climate station with 1991–2020 normals is Shelby Bottoms Nature. It records an average of 76 days a year with a low at or below 32°F — a moderate number of freezing nights. On roughly 68 of those days the temperature climbs back above freezing, so water in wood, soil and gaps between boards repeatedly freezes and thaws.
Frost is less severe in Nashville than in northern states, but footings still have to meet the local frost-depth requirement, and freeze-thaw cycles are enough to work loose nails and open checks in unsealed wood.
Snowfall is light — about 4.7 inches in an average year at Nashville Intl. AP — so occasional ice is a bigger concern than snow load. Textured boards and good drainage on stairs help on icy mornings.
Nashville sees about 50.5 inches of precipitation a year, with measurable rain or snow (0.1 inch or more) on about 81 days. Good drainage between boards, clean gaps and a ledger that is properly flashed keep that water from rotting the frame.
Summers are hot: average summer highs are near 88°F, with about 51 days a year reaching 90°F or more. Surface temperature is a real consideration — lighter board colors, shade from the house or a pergola, and heat-mitigating composite lines are worth comparing.
Which decking material makes the most sense in Nashville?
For most Nashville homes, light-colored composite or pressure-treated wood is the strongest starting point because about 51 days of 90°F+ heat make board color and surface temperature important.
Budget, upkeep tolerance and sun exposure on your particular lot still decide the final choice between these options.
| Material | How it handles Nashville's conditions |
|---|---|
| Pressure-treated pine | Economical; needs regular cleaning and sealing |
| Cedar | Attractive and stable; refinish to keep its color |
| Capped composite | Low maintenance; choose lighter colors for summer heat |
| PVC | Lightest and most moisture-proof; premium price |
What kinds of homes are in Nashville, and how does that shape deck design?
Nashville has about 183,449 housing units across its covered ZIP codes. 53% are single-family detached homes, 10% are attached homes such as townhouses and rowhouses, and about 38% are in buildings with two or more units. Roughly 57% of occupied homes are owner-occupied.
The mix of detached homes and attached or multi-unit housing in Nashville means deck projects range from large backyard decks to compact rear decks on narrow lots. Lot size, neighbors' sightlines and any association rules shape the right design.
What deck projects are most common in Nashville?
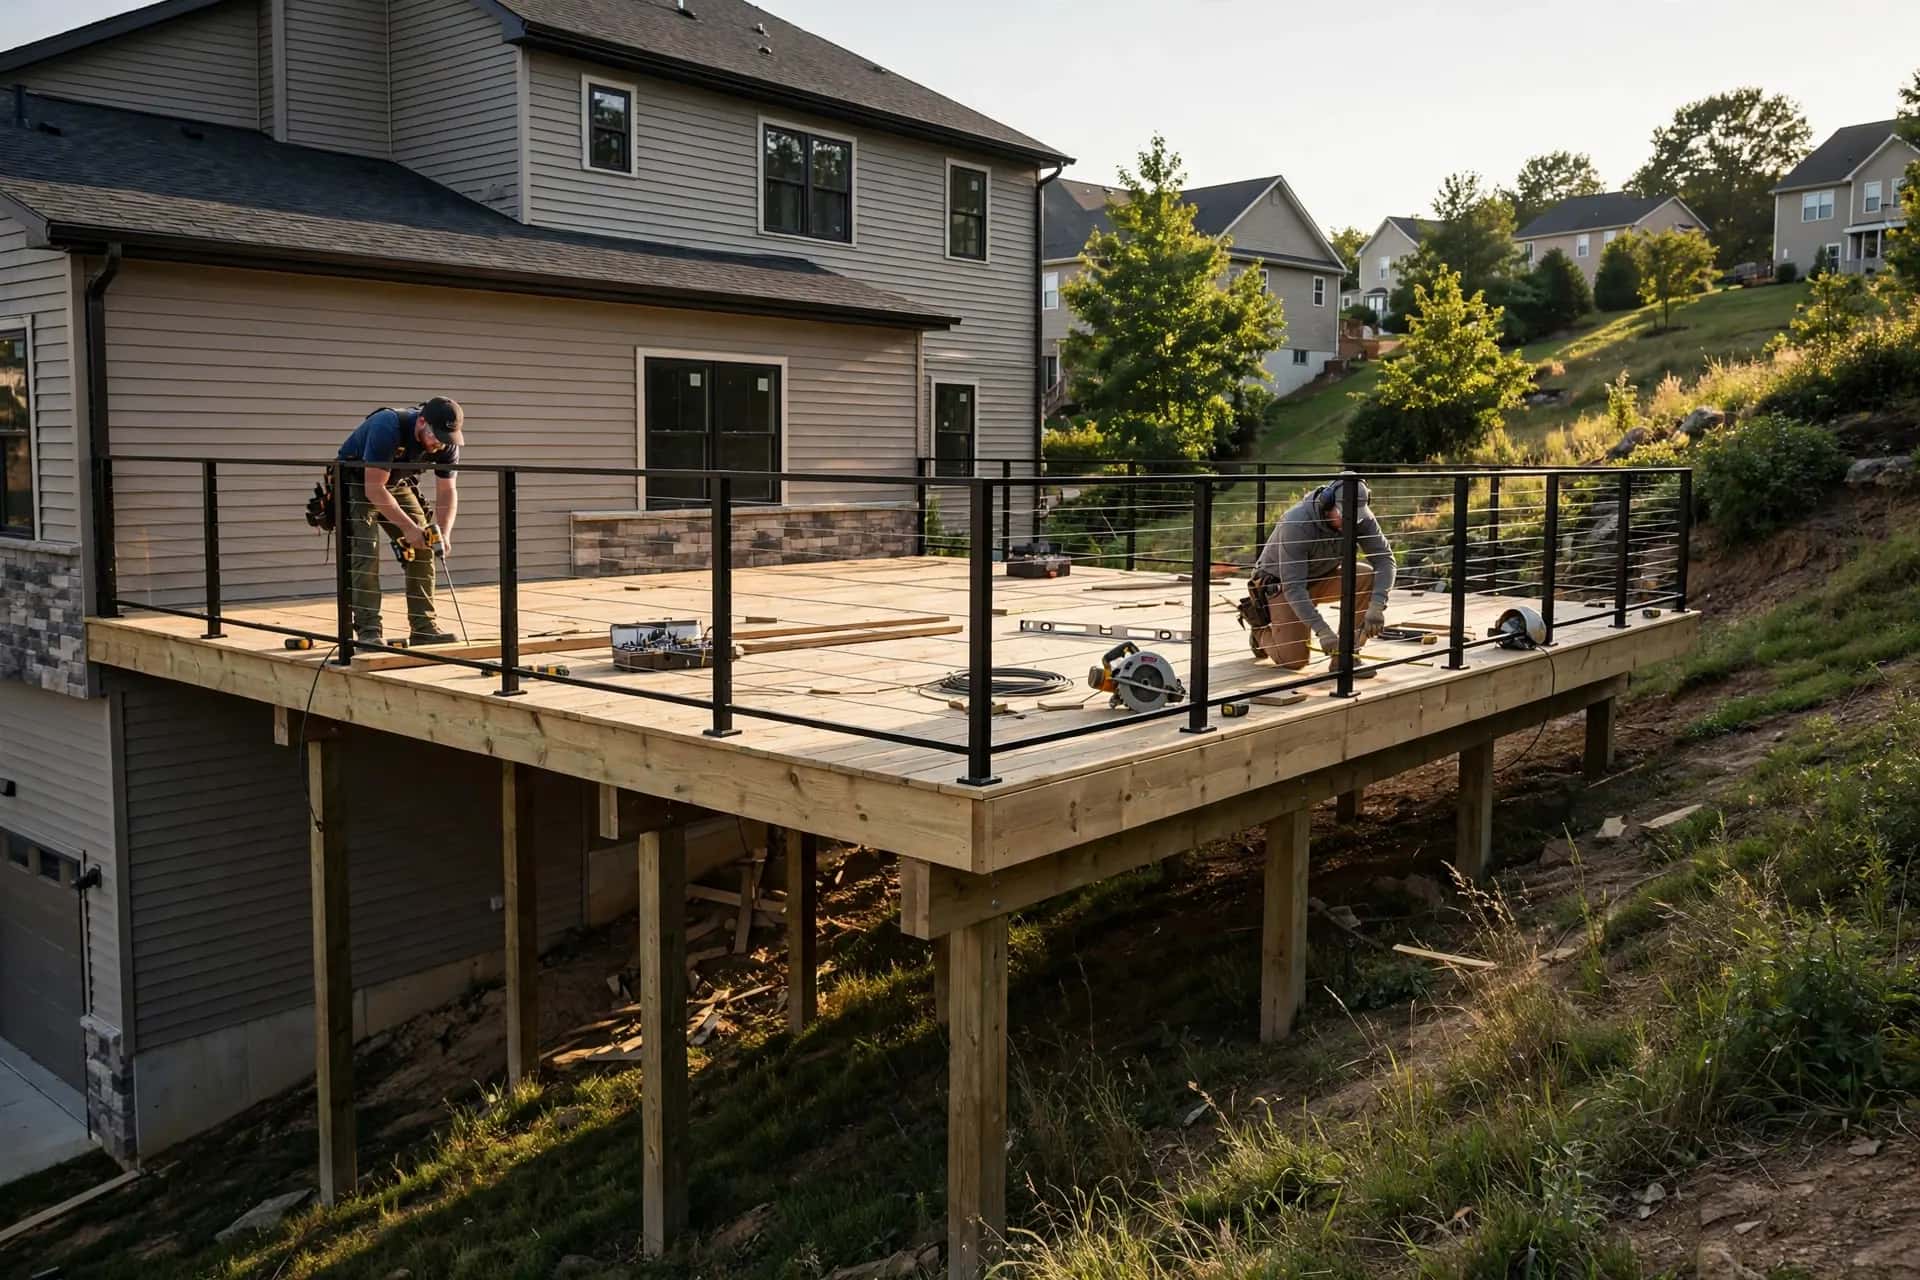
Based on the age of Nashville's housing, the largest group of projects is likely to be retrofitting or rebuilding decks added to older homes.
- Retrofit decks on older homes: about 68,102 homes (37%) predate 1970. Here the priority is confirming that add-on decks are properly attached — or rebuilding them freestanding — before any cosmetic work.
- Replacement and major repair: about 66,922 homes (36%) were built between 1970 and 1999, the age group whose original or early add-on decks are most likely to have worn-out framing, connectors and boards.
- Upgrades and expansions: about 29,593 homes (16%) were built since 2010. Their decks are usually sound but small or builder-grade, so enlarging the deck, adding stairs and switching to composite or upgraded railings are common.
When is the best time to plan a deck project in Nashville?
Nashville's milder winters — about 76 freezing nights a year — allow construction through most of the year. Peak summer heat (around 51 days at 90°F+) is the hardest time to apply stain or work in full sun, so many projects are scheduled for spring and fall.
Do you need a permit to build a deck in Nashville?
Often, yes — especially for attached or elevated decks — but the rules are set locally. Check with the building department that serves your address: the municipality, or Davidson County for unincorporated areas.
For Nashville, TN, ask the permit office whether your deck needs a permit based on its size, height and attachment to the house, which drawings and inspections are required. Statewide code background for Tennessee is on our state page; local rules change, so the building department remains the authority.
How does Nashville compare with nearby covered areas?
The closest covered area is Brentwood, about 8.8 miles from the center of Nashville's covered ZIPs. Its median home was built in 1996, 16 years later than in Nashville. Nashville has 25 percentage points fewer detached single-family homes (53% vs. 78%), which changes how many projects are backyard decks versus compact townhouse decks. Owner-occupancy is 57% in Nashville compared with 82% in Brentwood. Nashville's covered ZIP codes span about 202 square miles of land with roughly 183,449 homes — about 908 per square mile, a typical suburban density where most homes have usable backyards.
| Area | Distance | Median year built | Covered ZIPs |
|---|---|---|---|
| Brentwood | 8.8 mi | 1996 | 1 |
| Antioch | 9.4 mi | 1996 | 1 |
| Madison | 9.8 mi | 1977 | 1 |
| Hermitage | 11 mi | 1991 | 1 |
| Old Hickory | 12 mi | 1983 | 1 |
| La Vergne | 13.9 mi | 2001 | 1 |
How do Nashville's covered ZIP codes differ?
| ZIP | Homes | Median year built | Owner-occupied | County |
|---|---|---|---|---|
| 37204 | 8,016 | 1993 | 56% | Davidson County |
| 37205 | 12,641 | 1971 | 68% | Davidson County |
| 37206 | 14,065 | 1969 | 50% | Davidson County |
| 37207 | 19,727 | 1978 | 56% | Davidson County |
| 37210 | 9,521 | 1976 | 30% | Davidson County |
| 37211 | 35,911 | 1980 | 49% | Davidson County |
| 37212 | 8,288 | 1969 | 41% | Davidson County |
| 37213 | n/a | n/a | n/a | Davidson County |
| 37214 | 15,978 | 1983 | 63% | Davidson County |
| 37215 | 11,310 | 1980 | 76% | Davidson County |
| 37216 | 9,881 | 1960 | 70% | Davidson County |
| 37217 | 14,737 | 1978 | 41% | Davidson County |
| 37220 | 2,295 | 1962 | 91% | Davidson County |
| 37221 | 21,079 | 1991 | 71% | Davidson County |
| 37232 | n/a | n/a | n/a | Davidson County |
Deck planning checklist for Nashville homeowners
- Confirm your ZIP code is one of the 15 covered Nashville ZIPs.
- Find out when your current deck was built and whether it uses pre-2004 treated lumber.
- Test board samples in afternoon sun before choosing a color.
- Probe the ledger, post bases and joist tops for soft wood before planning a resurface.
- Call 811 before any digging so utility lines are marked.