
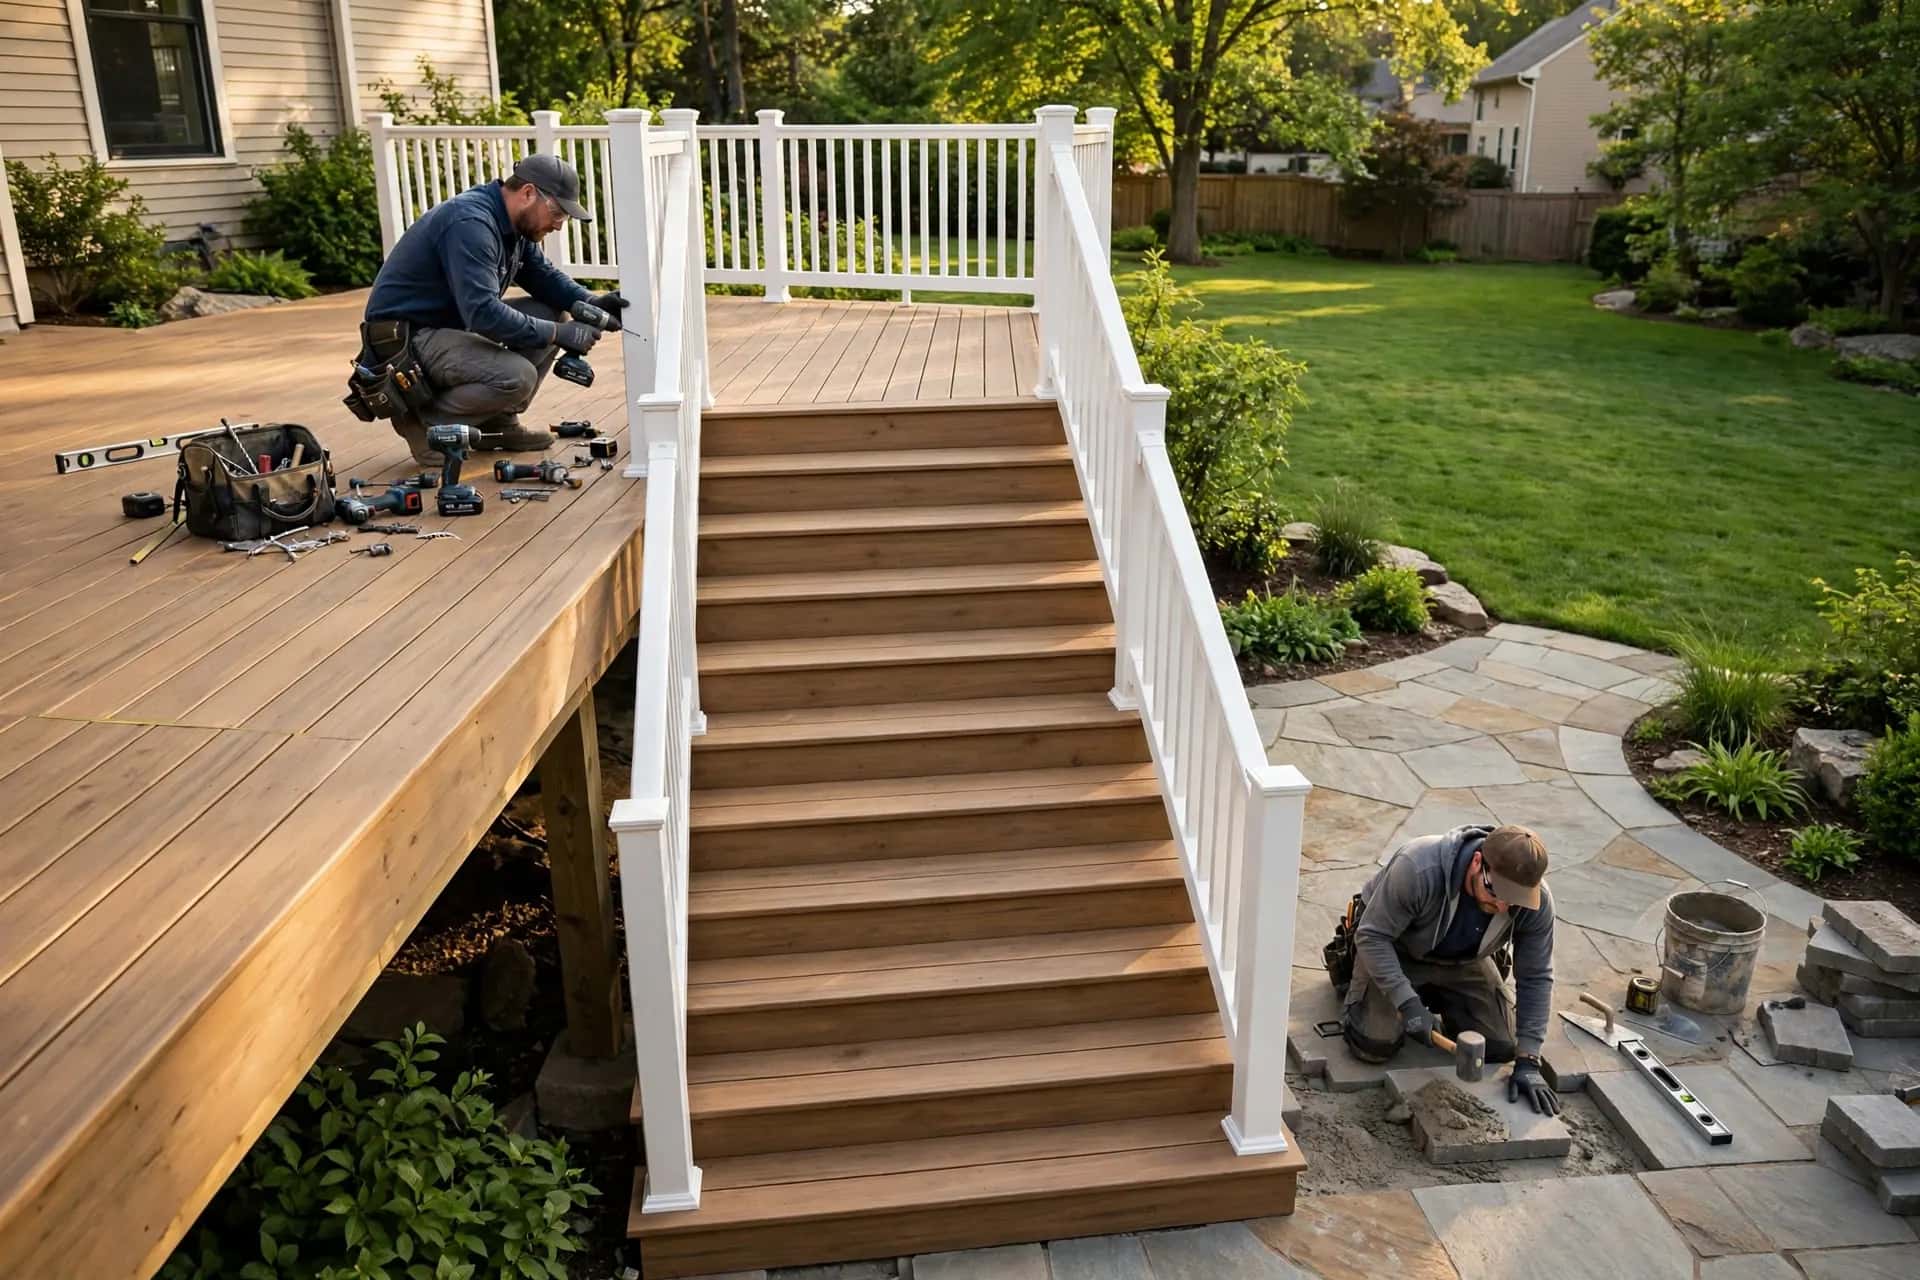
How old are homes in Lynnfield, and what does that mean for a deck?
15% of homes in Lynnfield's covered ZIP code were built in 2000 or later and 41% before 1960; the largest group dates to the 1950s.
The median home in Lynnfield dates to about 1965, roughly 61 years ago. Most homes from that era were built without a deck; the decks you see now were usually added in later decades, sometimes by previous owners with little documentation.
That history matters: retrofit decks are where missing ledger flashing, undersized footings and nailed-rather-than-bolted connections are most common. Before resurfacing or extending an add-on deck, it is worth confirming how it was framed and attached.
That makes Lynnfield's housing 5 years newer than Essex County as a whole, where the median home was built in 1960. Statewide, the median Massachusetts home was built in 1964. Among the 113 covered Massachusetts communities with Census data, Lynnfield ranks #67 for oldest housing. In this ZIP code, 41% of homes were built before 1960, 28% between 1960 and 1979, 15% between 1980 and 1999, and 15% since 2000 — the single largest group dates to the 1950s.
| Decade built | Homes | Share |
|---|---|---|
| 2020 or later | 48 | 1% |
| 2010s | 451 | 9% |
| 2000s | 240 | 5% |
| 1990s | 286 | 6% |
| 1980s | 433 | 9% |
| 1970s | 570 | 12% |
| 1960s | 800 | 17% |
| 1950s | 1,008 | 21% |
| 1940s | 363 | 8% |
| before 1940 | 616 | 13% |
What does Lynnfield's climate mean for deck construction?
Lynnfield averages about 129 days a year at or below freezing, 47.8 inches of snow and 48.1 inches of precipitation, based on NOAA 1991–2020 normals.
The nearest NOAA climate station with 1991–2020 normals is Middleton, about 4 miles away. It records an average of 129 days a year with a low at or below 32°F — a substantial freezing season. On roughly 111 of those days the temperature climbs back above freezing, so water in wood, soil and gaps between boards repeatedly freezes and thaws.
For Lynnfield, that means footings must bear below the locally required frost depth to avoid heaving, and wood surfaces should be kept sealed so absorbed water doesn't split boards over winter. Synthetic decking tolerates freeze-thaw well but still needs the manufacturer's expansion gaps.
Snow is a major factor: the Middleton station averages about 47.8 inches a year. Framing has to carry snow load, stairs need a plan for winter use, and snow removal should be done with plastic-bladed shovels and ice-melt products the decking manufacturer allows.
Lynnfield sees about 48.1 inches of precipitation a year, with measurable rain or snow (0.1 inch or more) on about 85 days. Good drainage between boards, clean gaps and a ledger that is properly flashed keep that water from rotting the frame.
Average summer highs reach about 79°F, and around 16 days a year top 90°F. On a deck with full afternoon sun, dark composite can get uncomfortable on those days, so test samples in the sun before choosing a color.
Which decking material makes the most sense in Lynnfield?
For most Lynnfield homes, capped composite is the strongest starting point because about 111 freeze-thaw days a year are hard on unsealed wood and roughly 47.8 inches of snow a year means regular shoveling.
On Lynnfield's many older homes, a wood-look capped composite or a stained cedar deck usually suits the architecture better than high-gloss boards.
| Material | How it handles Lynnfield's conditions |
|---|---|
| Pressure-treated pine | Economical; needs sealing to resist freeze-thaw splitting |
| Cedar | Attractive and stable; refinish to keep its color |
| Capped composite | Low maintenance; handles moisture and freeze-thaw well |
| PVC | Lightest and most moisture-proof; premium price |
What kinds of homes are in Lynnfield, and how does that shape deck design?
Lynnfield has about 4,815 housing units across its covered ZIP code. 78% are single-family detached homes, 5% are attached homes such as townhouses and rowhouses, and about 17% are in buildings with two or more units. Roughly 88% of occupied homes are owner-occupied.
Detached single-family homes dominate in Lynnfield, so most decks are backyard decks attached to the rear of the house. That gives more freedom on size, layout and stairs, and makes a well-planned deck one of the most-used rooms of the home.
What deck projects are most common in Lynnfield?
Based on the age of Lynnfield's housing, the largest group of projects is likely to be retrofitting or rebuilding decks added to older homes.
- Retrofit decks on older homes: about 2,787 homes (58%) predate 1970. Here the priority is confirming that add-on decks are properly attached — or rebuilding them freestanding — before any cosmetic work.
- Replacement and major repair: about 1,289 homes (27%) were built between 1970 and 1999, the age group whose original or early add-on decks are most likely to have worn-out framing, connectors and boards.
- Upgrades and expansions: about 499 homes (10%) were built since 2010. Their decks are usually sound but small or builder-grade, so enlarging the deck, adding stairs and switching to composite or upgraded railings are common.
When is the best time to plan a deck project in Lynnfield?
Lynnfield has a defined building season. Spring and early fall offer the most comfortable working weather; winter is a good time to settle the design and apply for permits. Stains and sealers generally need dry weather and moderate temperatures, so plan wood finishing for late spring or early fall.
Do you need a permit to build a deck in Lynnfield?
Often, yes — especially for attached or elevated decks — but the rules are set locally. Check with the building department that serves your address: the municipality, or Essex County for unincorporated areas.
For Lynnfield, MA, ask the permit office whether your deck needs a permit based on its size, height and attachment to the house, which drawings and inspections are required. Statewide code background for Massachusetts is on our state page; local rules change, so the building department remains the authority.
How does Lynnfield compare with nearby covered areas?
The closest covered area is Wakefield, about 2.4 miles from the center of Lynnfield's covered ZIPs. Its median home was built in 1956, 9 years earlier than in Lynnfield. Lynnfield has 24 percentage points more detached single-family homes (78% vs. 54%), which changes how many projects are backyard decks versus compact townhouse decks. Owner-occupancy is 88% in Lynnfield compared with 71% in Wakefield. Lynnfield's covered ZIP code span about 10.1 square miles of land with roughly 4,815 homes — about 477 per square mile, a low density that usually allows larger decks and freestanding designs.
| Area | Distance | Median year built | Covered ZIPs |
|---|---|---|---|
| Wakefield | 2.4 mi | 1956 | 1 |
| Reading | 3.4 mi | 1960 | 1 |
| Peabody | 3.5 mi | 1966 | 1 |
| North Reading | 3.9 mi | 1975 | 1 |
| Hathorne | 4.5 mi | n/a | 1 |
| Saugus | 4.6 mi | 1962 | 1 |
Deck planning checklist for Lynnfield homeowners
- Confirm your ZIP code is 01940, the covered Lynnfield ZIP.
- Find out when your current deck was built and whether it uses pre-2004 treated lumber.
- Ask whether a freestanding design avoids attaching to older house framing.
- Ask what footing depth your building department requires for frost.
- Plan stair location and snow storage so winter shoveling doesn't damage boards or railings.
- Probe the ledger, post bases and joist tops for soft wood before planning a resurface.
- Call 811 before any digging so utility lines are marked.